
Anybody investing in the stock market is aware of the put and call ratio. A put-call ratio is a method for market predictions. For the longest time, this ratio has been predicting whether the market is stable or volatile. And people who trade on a regular basis depend on these two factors to sense the mood of the market.
What is an options chain?
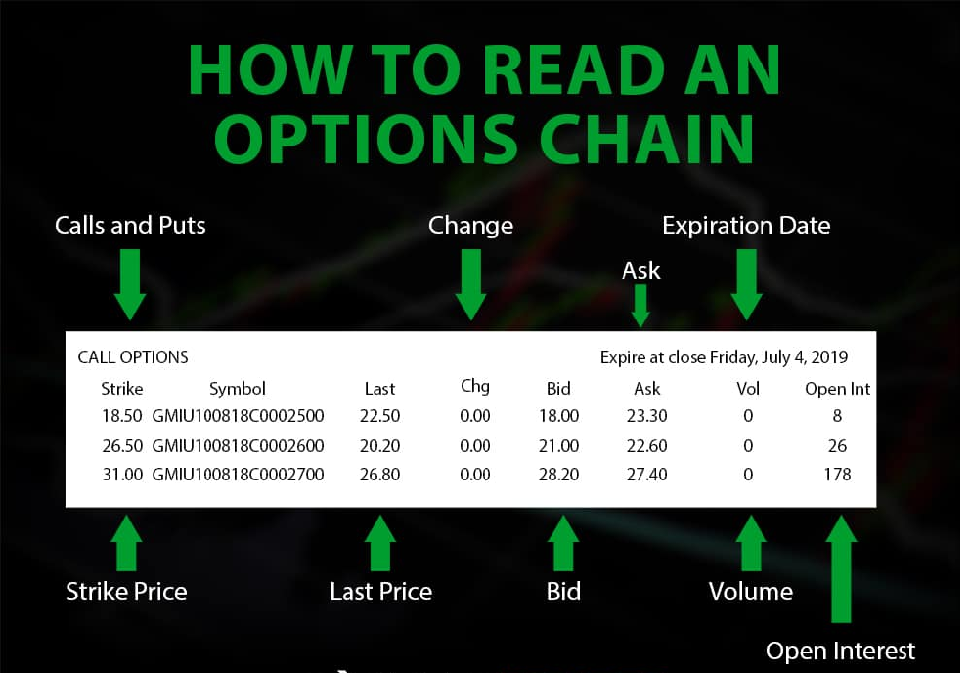
Option Chain is a tabular form divided mainly into Call Option and Put Option, followed by other elements. The option chain is also called as option matrix since it enlists all the available units and gives the put, call and strike prices for the assets, till the maturity period. The option chain helps most in predicting the trade market for the following day.
Components of an options chain:
Strike Price – Strike price is the agreed price of a share in the market. That is the price that the buyer agreed to purchase on, and the seller agreed to sell on. A share becomes profitable after the share is sold at a higher price than the strike price.
OI – OI is an acronym for Open Interest. Open Interest gives the list of shares in the market that are open and have not been traded yet. More the number of shares higher will be the interest among traders to know the strike price of the share. Therefore, you get more chances to liquidate your shares.
Change in OI – Change in Open Interest tells you about the shares that have been squared or closed. If there is a sudden surge in the open interest, it should be carefully monitored.
Volume – It is another unit to measure the open interest in the market. It gives us an estimate of the total number of shares that are traded in the market at a particular strike price. Since this is calculated on a daily basis, it helps you understand the current preference among traders.
IV – IV stands for Implied Volatility. It gives us a picture of what could be the underlying situation of the market. If the IV is higher, there could be a spike in prices, and if the IV is lower, it signifies less risk. However, it cannot tell if the graph is moving upward or downward, in terms of the movement of the prices.
LTP – It means the last traded price of a share.
Net Change– It is the change in the LTP (last traded price). A positive change denotes a rise in price, and a negative change denotes a decline in price.
Bid Qty – The number of shares that are purchased based on the strike price. This gives an indication of the current demand for a particular share.
Bid Price – It is the last price quoted for a particular share. So, if the price of a share is higher than the LTP, then it suggests that demand for that share is rising.
Ask Price – The price that was quoted during the last sell order.
Ask Qty – The number of open shares at a particular strike price. It gives an idea about the supply of the option.
Learning every element of the table helps you understand the stock market better. This also makes you aware and helps in making smart decisions. So, learn these methods and start trading today!